Leading-Edge Objective Cognitive Assessment Testing

The world's LARGEST standardized neuroscientific database.

BrainView System


The BrainView system is a cutting-edge hardware and software system that allows for an objective measure of cognitive function assessment using EEG, electrocardiogram activity (ECG), visual and auditory processing speeds (evoked potentials), and a subjective neuropsychological survey.

The BrainView system is designed to help the physician effectively diagnose biomarkers related to seizures, memory loss, cognitive impairment, and other stress-related neurological conditions. In addition, a neuro-functional physiology report of the results is provided, including a data summary, raw data, and images.

Request Information
The BrainView system is portable, easy to use, and noninvasive.

The BrainView system enables a physician to collect the patient's neuro-physiological biomarkers, which profile the patient's neurological function. The system allows the physician to gain additional clinical information vital to making a well-informed patient-care decision.

BrainView is backed by more than 30 years of globally celebrated, peer-reviewed scientific research.
At BrainView, we stay at the forefront of brain health research, collaborating with experts in neurology, cognitive science, and computer science to develop boundary-pushing methods for brain signal analysis.
Since the earliest evoked responses were reported in 1939, there are now over 160,000 published studies on the PubMed.gov database.

Our latest R&D efforts have been on developing an Artificial Intelligence (AI) biomarker for ADHD, TBI, PTSD and Alzheimer's disease diagnosis. We're currently conducting several IRB approved studies, using Evoke to measure EEG & ERP biomarkers. BrainView Machine-Learning models are based on more than 200,000 EEG reports database.

What do we do?


BrainView offers healthcare providers an understanding of EEG/ERP associated with various neurological disorders and explains how they correlate to brain performance and behavior.
BrainView offers in-depth analyses, including comparing normative databases, ERP interpretation, and Low-Resolution Electromagnetic Tomography (eLORETA).

BrainView assists healthcare providers in understanding what the brain's activity means to their patients in terms of everyday function and behavior. In addition, we provide recommendations of ways that neuroscience can improve and optimize brain function. This deep comprehension is essential for the referring treatment team to understand the patient's EEG and ERP data, clinical presentation, and the best treatment options available.

The Science Behind BrainView


BrainView equips healthcare professionals with essential cognitive measures to enable proactive care and personalized treatment.
By detecting early signs of cognitive decline, BrainView helps clinicians develop customized treatment protocols that optimize patient outcomes and improve overall brain health.

Brain Maps

Computational EEG head maps visually compare a patient's brain activity against a standardized database. BrainView physicians receive onboarding training and ongoing clinical education, enabling them to recognize various patterns in head maps that can facilitate accurate diagnoses.

Brain Biomarkers

Objective metrics derived from computational EEG data provide valuable insights into brain function. For example, Peak Alpha Frequency reflects cognitive capacity and physiological aging, while the Theta/Beta Ratio relates to inattention and is FDA-cleared to assist in diagnosing ADHD.

Event-Related Potentials (ERP)

ERPs assess the brain's processing speed and efficiency. These sensitive biomarkers can detect neuro-functional abnormalities even before clinical symptoms emerge.


Neuropsychological Testing

Go/no-go tasks evaluate a patient's cognitive and behavioral performance, providing insights into their ability to carry out daily tasks. Metrics such as reaction time, variability, omission errors, and commission errors help assess overall cognitive status.

Mental Health Questionnaires

BrainView simplifies the identification of non neuro-degenerative causes of cognitive impairment through computerized administration of standardized tools, including GAD-7, PCL-C, PHQ-9, PSC-17, and the DSM-5 Cross-Cutting Symptom Measure.

Digital EEG spike & seizure analysis

Cutting-edge seizure detection tools enhance the precision of neurological diagnoses and treatment planning. BrainView integrates an FDA-cleared suite of EEG Trending, Seizure, and Spike Detection tools for more accurate diagnosis and management of neurological conditions.


Frequency-based analysis of EEG data


The brain functions as a continuous oscillator, generating rhythmic activity even in the absence of external stimuli, such as during sleep. Therefore, for the brain activity that drives our behavior, thoughts, motivations, and emotions, a different analytic approach is required based on the analysis of the frequencies, rather than traditional time-based methods.
Understanding Brain Frequencies

The brain primarily operates within the frequency range of 1 to 80 Hertz, with distinct frequency bands classified as delta, theta, alpha, beta, and gamma. These bands are closely associated with specific brain regions and play key roles in attention, cognition, and emotional processing.

  • Delta (1-4 Hz) - Linked to deep sleep and unconscious processes.
  • Theta (4-8 Hz) - Associated with mental workload, drowsiness, and memory processing.
  • Alpha (8-12 Hz) - Related to relaxation, attention, and cognitive states.
  • Beta (12-30 Hz) - Involved in active thinking, focus, and problem-solving.
  • Gamma (30-80 Hz) - Associated with high-level cognitive functioning and consciousness.

Frequency analyses are closely linked to physiological processes and brain structures. This is why it is often much easier to stick to the analysis of frequencies and frequency bands. Another benefit of frequency analysis is that much less data is required to arrive at conclusions.
Frequency-based analysis is particularly useful when testing time is limited. Instead of focusing on the precise timing of responses to stimuli, it evaluates the overall cognitive, emotional, or mental state of the respondent. This makes it especially valuable in studying cognitive-affective states through EEG measurements.
Fast Fourier Transform (FFT) in EEG Analysis

The raw EEG signal is a time-domain representation of electrical activity, with time on the x-axis and voltage on the y-axis. The Fast Fourier Transform (FFT) converts this EEG signal into the frequency domain, where frequency is plotted on the x-axis and voltage power on the y-axis.

The FFT algorithm works by comparing the EEG signal to sine waves of various frequencies. The greater the similarity between the EEG data and a particular sine wave, the stronger the presence of that frequency in the signal.

FFT can analyze the entire frequency content in a signal ranging from 1 to 45 Hz (since this range contains all of the cognitive-affective frequency bands). The stronger a particular frequency, the higher the likelihood that the respondent is in a specific cognitive-affective state associated with that frequency.
For example: Higher theta power suggests an increased mental workload; Increased delta power is typically observed during sleep.

One of the key metrics in frequency analysis is power, which represents the strength of a particular frequency in the EEG signal. Higher power means that a specific frequency dominates the EEG activity, reflecting the brain's engagement in particular states.

Recording EEG in Different Conditions

To perform a frequency-based EEG analysis, brain activity is recorded in two conditions:

Eyes Open: The patient keeps their eyes open for 5-10 minutes while EEG data is recorded (blinking is partially allowed).

Eyes Closed: The patient closes their eyes for another 5-10 minutes, focusing on internal thoughts and mental imagery.

Peak Alpha Frequency


Comparing EEG signals from both conditions (eyes open, closed) reveals a significant change in alpha power (8-12 Hz) in the occipital region. When the eyes are closed, alpha power increases significantly, while opening the eyes causes a reduction in alpha activity. This alpha-blocking effect was first described by Hans Berger in 1929 and is a well-established marker of visual attention and cognitive engagement.

The alpha frequency band (8 - 12 Hz) is the most dominant EEG frequency found in the brain. The Peak Alpha Frequency (PAF), or posterior dominant rhythm, is primarily generated by the thalamus and reflects thalamocortical network activity; therefore, PAF can be conceptualized as the brain's pacemaker and is known to be a good measure of information processing capacity.

EEG studies have found that PAF rises from childhood to adolescence and decreases slowly around 11 years old. Regardless of age, individuals with strong working memory abilities have faster PAF than inferior memory performers. Conversely, abnormally low PAF (< 8 Hz) is found in cognitive disturbances and dementia patients. At the same time, a slowed PAF is correlated with the loss of hippocampal volume in many posterior regions of the brain in individuals suffering from MCI. Therefore, the PAF electrophysiology biomarker is used to help identify patients with preclinical dementia and monitor a patient's overall cognitive capacity over time.

Peak frequency is a biomarker that tells us about the frequency within a band with the highest amplitude. For example, in the alpha band (8-12 Hz), 10 Hz should be highest in most adults. Values rising above may result in problems experienced by the patient, depending on where we see this, and peaks below 8Hz can often result in cognitive difficulties and word-finding problems.

What is BrainView QEEG?


Quantitative Electroencephalography (QEEG) is a procedure that processes recorded EEG activity from a multi-electrode recording using a computer. The patient's digital EEG data is statistically analyzed and compared to normative database reference values in order to provide insight into differential diagnoses and effects of treatment. The processed EEG is commonly converted into color maps of brain functioning called "brain maps". The EEG and the derived QEEG information can be interpreted and used by experts as a clinical tool to evaluate brain function, and to track the changes in brain function due to various interventions such as neurofeedback or medication. QEEG processing techniques and advanced software allow the brain to view dynamic changes during a cognitive process. This novel approach assists in determining which areas of the brain are engaged and processing efficiently.

How is QEEG Brain Mapping Used?

Using QEEG, we can visualize and understand how the various parts of the brain function under different conditions. Through this, we can identify areas working well and functioning abnormally. Once this information is obtained, a proper management plant can be created, which focuses on improving the areas functioning sub-optimally.
What is QEEG Database?

QEEG stands for Quantitative Electroencephalography, commonly known as brain mapping. It can identify neuro markers or EEG phenotypes for various psychiatric disorders such as ADHD, Alzheimer's, Depression, dementia, schizophrenia, and PTSD. In addition, this information aids in forming personalizing treatments such as Neurofeedback or rTMS.

In addition to a wide range of diagnostic groups in a database, it is also necessary to have an excellent normative reference frame. Our normative database includes more than 40,000 healthy subjects and large patient groups with ADHD, TBI, PTSD, Alzheimer's disease, and Depression. The database also includes neurophysiological and neuropsychological data.

At the BrainView Research Institute, we have for the last decades been researching the optimal use of BrainView QEEG for optimizing psychiatric treatments. Furthermore, with our research, we are constantly pushing the envelope with the newest technologies and advances, such as source-localization, cross-frequency coupling, and deep learning to advance a future of stratified psychiatry or personalized psychiatry further.

The QEEG provides further analysis of visual EEG interpretation, offering more insight into understanding brain function. Quantitative Electroencephalography (qEEG) is a tool that processes recorded EEG activity using a computer. Electrical activity is measured by analysis of brain wave patterns. QEEG uses various algorithms, including wavelet analysis. The analyzed data is compared to a standard norm derived from a database.

The use of advanced techniques such as Independent Component Analysis (ICA) and neuro-imaging techniques such as Low Resolution Electromagnetic Tomography (eLORETA) can map the actual sources of the cortical rhythms. These advanced approaches are changing our understanding of the dynamics and function of the human brain.

Event-related potentials (ERPs)


Event-related electroencephalography (EEG) is an advanced method that allows researchers and clinicians to observe how the brain responds specifically to external stimuli, such as visual or auditory signals. The goal is to measure and isolate brain activity responses directly related to the presented stimulus, providing precise insights into cognitive processes.

How Does Event-Related EEG Work?

Baseline Brain Activity vs. Stimulus Response: At rest, your brain performs continuous EEG activity, consider it the background noise activity reflecting your ongoing mental state and internal thoughts. When a stimulus is presented, it triggers distinct brain responses. The challenge is isolating these stimulus-specific responses from the ongoing, unrelated EEG background activity.
Stimulus-Triggered Activity: When a sensory stimulus (visual or auditory) is introduced, the brain generates a specific electrical response known as an Event-Related Potential (ERP). For example, viewing an image or hearing a sound will elicit unique EEG patterns (from each electrode) directly linked to processing that stimulus.

Multiple Trials for Accuracy: Stimuli are briefly presented multiple times (usually 30 or more trials). EEG data are recorded and segmented around each stimulus (epoch), typically ranging from 200ms before to 1000ms after stimulus presentation.

Data Averaging Technique: After removing trials affected by artifacts (such as eye movements or muscle activity), the remaining EEG segments are averaged across trials. Through averaging, unrelated background activity ("noise") is reduced, leaving clearer and more precise stimulus-related EEG response patterns.

Resulting Data: The averaged EEG segments result in a clear waveform, known as an event-related potential (ERP). ERP response waveforms reflect distinct cognitive processes, with each component identified by its shape, latency (time), amplitude (strength), and scalp topography (the pattern of activity across electrodes).
Characteristics of Event-Related Potentials (ERPs)

ERPs can be described using several key characteristics:

  • Shape and appearance - The overall waveform pattern.
  • Number and timing of components - Positive and negative peaks in the signal.
  • Latency - The time at which different components appear relative to stimulus onset.
  • Amplitude - The strength of the response at specific time points.
  • Topography - The spatial distribution of voltages across different EEG electrodes.


Some of the most well-researched ERP components include:

  • N200 - Involved in facial recognition and early visual processing.
  • P300 - Associated with attention and stimulus evaluation.
  • N400 - Related to semantic processing and language comprehension.

Clinical and Research Applications of ERPs

ERPs help identify and analyze cognitive processing differences across conditions or populations.

Scientists often compare ERPs under different experimental conditions, such as:
  • Face stimuli vs. house stimuli - To study visual processing differences.
  • Children with Autism Spectrum Disorder (ASD) vs. age-matched neurotypical controls - To examine neurodevelopmental differences.

Comparisons typically focus on ERP latency, amplitude, or topographic differences between conditions or participant groups. By analyzing these variations, researchers gain deeper insights into cognitive processing, perception, and neurological disorders.

What is an ERP Analysis?


Event-related potentials (ERP) are also called evoked potentials (EP) and measure the brain's direct response to a specific sensory, cognitive, or motor event. EPRs can measure (to the millisecond) the brain's speed to process this information. This fast-paced processing allows us as humans to receive, filter, and process billions of pieces of information to make split-second decisions every second of every day. Due to the sensitivity of ERP testing, we can detect changes in this processing speed related to cognitive decline. Performing testing early on can show changes before becoming physically noticeable. As a result, the ERP can detect slowing in physical reaction times, decision-making skills, stress disorders, memory loss, and other neurological disorders.

An Event-Related Potential (ERP) is an electrical potential detected by Electroencephalography (EEG) used to understand how the brain processes visual and auditory information. It occurs after a sensory stimulus occurs. ERPs are measured while a patient is engaged in a task. It is an added tool used and often offers more detail than the standard detailed neurological examination.
Memory functions and cognitive processes within the brain can be measured using event-related potentials (ERPs). The latency or time delay between the onset of the stimulus and a patient's physical response reflects brain processing speed. In contrast, waveform amplitude reflects neuronal recruitment and subsequent activation of the recruited neurons to process the information.

Fundamental ERP elements include the degree of attention to stimulus and the subsequent encoding of information for storage and retrieval. P300a and P300b are two ERP components useful in measuring these aspects of memory and brain activity. The P300b component has been exceptionally well-studied regarding memory loss disorders, such as Mild Cognitive Impairment (MCI) and Alzheimer's disease (AD). When comparing AD to age-matched controls, AD patients had longer P300b latency measures and low amplitudes. P300b latency and amplitude can predict the progression of mild cognitive impairment. Additionally, P300b metrics demonstrate superior sensitivity over conventional assessments, such as the MMSE, detecting early preclinical memory loss.

ERP helps understand how the brain processes information and how long it takes to respond to sensory stimuli. Using ERP analysis, we better understand how the brain is processing while a patient is performing activities of daily living.

Visual evoked potential (VEP)


A visual evoked potential is caused by a visual stimulus, such as an alternating checkerboard pattern on a computer screen. Responses are recorded from electrodes placed on the head and observed as a reading on an electroencephalogram (EEG). These responses usually originate from the occipital cortex, the area of the brain involved in receiving and interpreting visual signals.
When is the VEP used?

A physician may recommend a VEP test when experiencing changes in vision due to problems along the pathways of specific nerves.

Some of these symptoms may include:

  • Loss of vision
  • Double vision
  • Blurred vision
  • Flashing lights
  • Alterations in color vision
  • Weaknesses of the eyes, arms, or legs

These changes are often too subtle or not easily detected on clinical examination in the doctor's surgery. In general terms, the test helps detect optic nerve problems. This nerve helps transfer signals to see, so testing the nerve allows the physician to see how the visual system responds to light. The test is also helpful because it can check vision in children and adults who cannot read eye charts.
What does the VEP detect?

The VEP measures the time it takes for a visual stimulus to travel from the eye to the occipital cortex. Therefore, it can give the physician an idea of whether the nerve pathways are abnormal in any way. For example, the insulating layer around nerve cells in the brain and spinal cord (known as the myelin sheath) can be affected by multiple sclerosis. This means it takes longer for electrical signals to be conducted from the eyes, resulting in abnormal VEP.

What the results may show

The VEP is beneficial in detecting past optic neuritis. Neuritis refers to inflammation of the optic nerve, associated with swelling and the progressive destruction of the sheath covering the nerve and sometimes the nerve cable. As the nerve sheath is damaged, it takes prolonged time for electrical signals to conduct to the eyes, resulting in abnormal VEP. This may be seen in multiple sclerosis - one of the most common causes of optic neuritis (as above). Therefore, abnormal VEP's are seen in multiple sclerosis patients due to optic neuritis.

The following are less easily differentiated but may cause abnormal VEPs:

- Optic neuropathy can be due to damage of the optic nerve from several causes, including a blockage of the nerve's blood supply, nutritional deficiencies, or toxins.
- If the tumors or lesions compressing the optic nerve pathways for conduction are affected, an abnormal VEP appears.
- Glaucoma - patients who suffer from glaucoma have increased intraocular pressure (i.e., the pressure inside the eye). Pressure can damage the optic nerve, leading to prolonged VEPs.
- Ocular hypertension (high pressure) refers to any situation in which the pressure in the eye is higher than average.

Source Analysis - 3D Brain Mapping


Source analysis is a new method for localizing the electrical activity in the brain based on scalp potentials from multiple-channel EEG recording. This revolutionary technique was called LORETA, standing for low-resolution brain electromagnetic tomography, and can be understood as an EEG-based neuro-imagining technique. LORETA transform surface EEG data into a three-dimensional distribution of electric neuronal activity in the grey matter.

We attempt to bridge the gap between surface EEG data and the respective neural source generators: EEG dynamics reflect the collective action (superposition) of many neuronal systems distributed across the brain with EEG source analysis. Source analysis disentangles the different neuronal sources and hints where and when it happened. Information pathways in the brain can be studied using either the reconstructed activation waveforms or time-frequency analysis. Source analysis can identify the brain regions involved in different tasks and depend on data quality and model quality, yield a precise localization of the generators in both space and time.
What is Low-Resolution Electromagnetic Tomography (LORETA)?

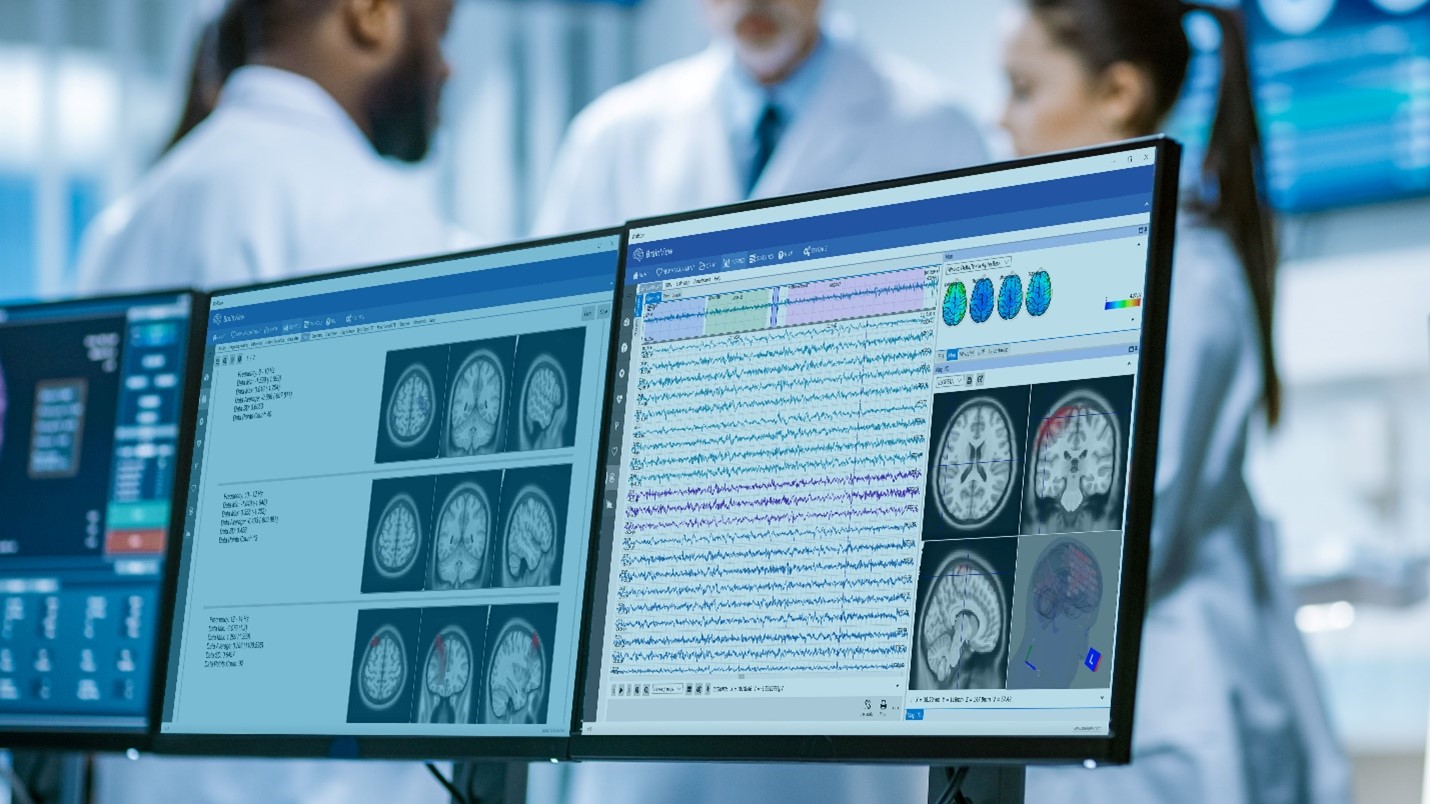
Neuro-imagining techniques aim to represent the structure or functioning of the brain. They can be understood as an X-ray photograph of the brain that, in the case of functional imagining, will show the brain areas activated during a process or cognitive task, and techniques such as EEG or MEG are examples.

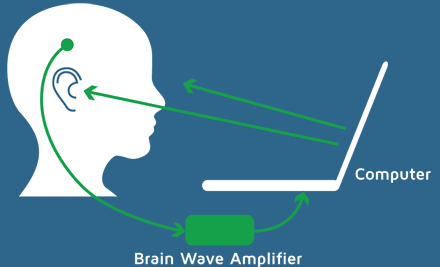
Pascual-Marqui, Michel, and Lehman published in 1994 a new method for localizing the electrical activity in the brain based on scalp potentials from multiple-channel EEG recording. This method solves the inverse problem: convert measurements into information about a physical object or system observed. This revolutionary technique was called LORETA, standing for low-resolution brain electromagnetic tomography, and can be understood as an EEG-based neuro-imagining technique. LORETA computes a three-dimensional distribution of 2400 voxels of 10x10x10mm, generating electric neuronal activity in the grey matter. A significant advantage of this technique is that it is not restricted to a certain number of electrodes or electrode locations. Therefore, it self-adapts to almost every electrode set-up and EEG measuring device.

  • sLORETA: standardized low-resolution brain electromagnetic tomography (Pascual-Marqui, 2002). It has no localization bias in the presence of measurement and biological noise.
  • eLORETA: fast low-resolution brain electromagnetic tomography (Pacual-Marqui 2005). The first-ever 3D, discrete, distributed, a linear solution to the inverse problem of EEG/MEG with exact localization (zero localization error).

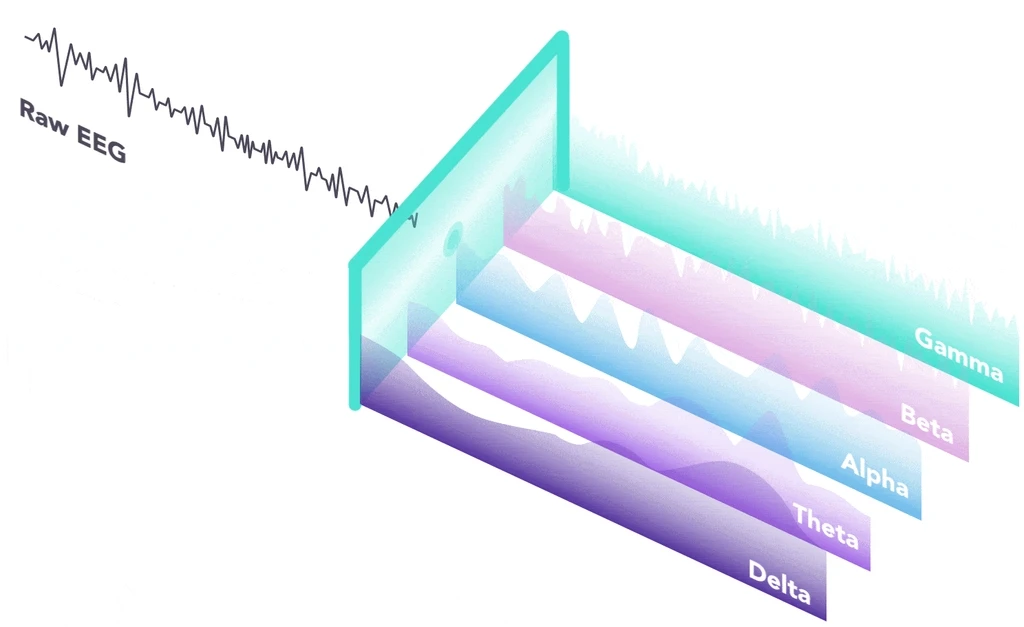
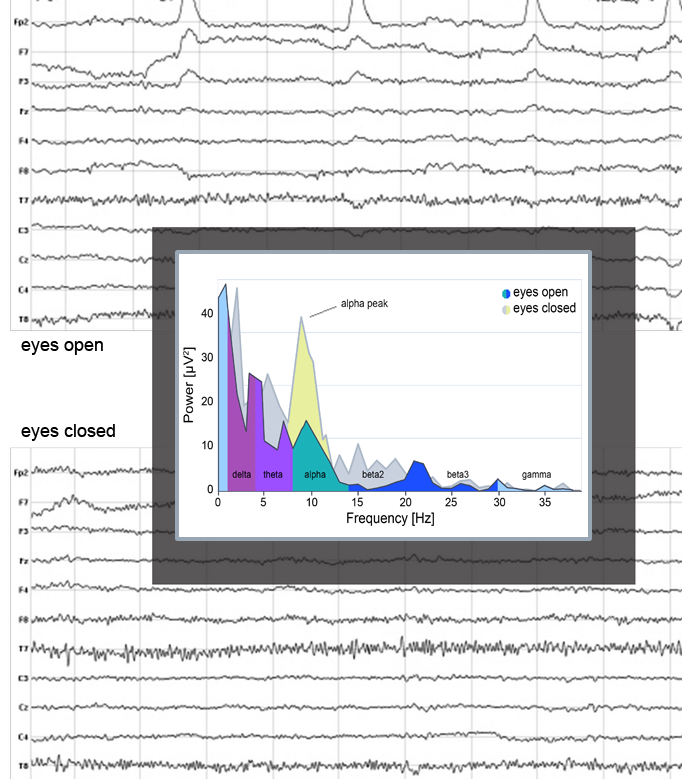
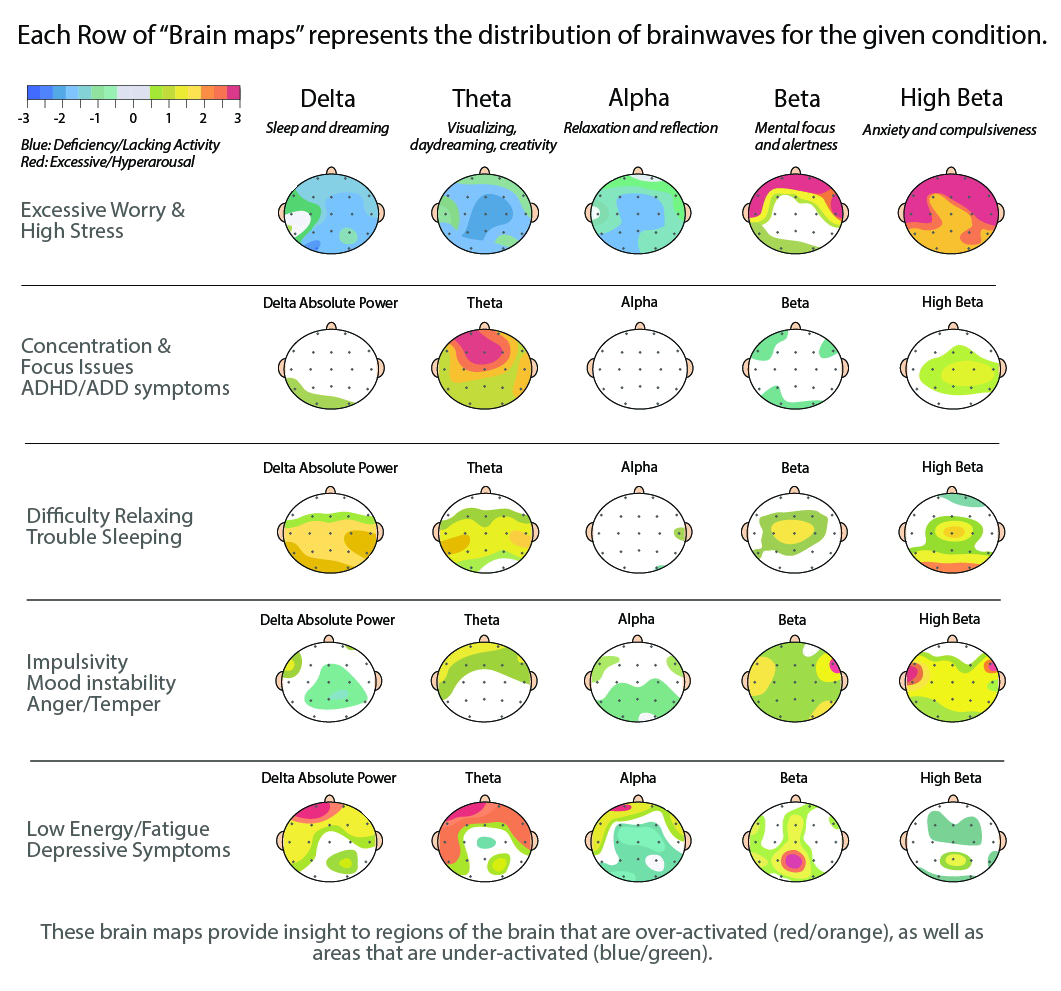
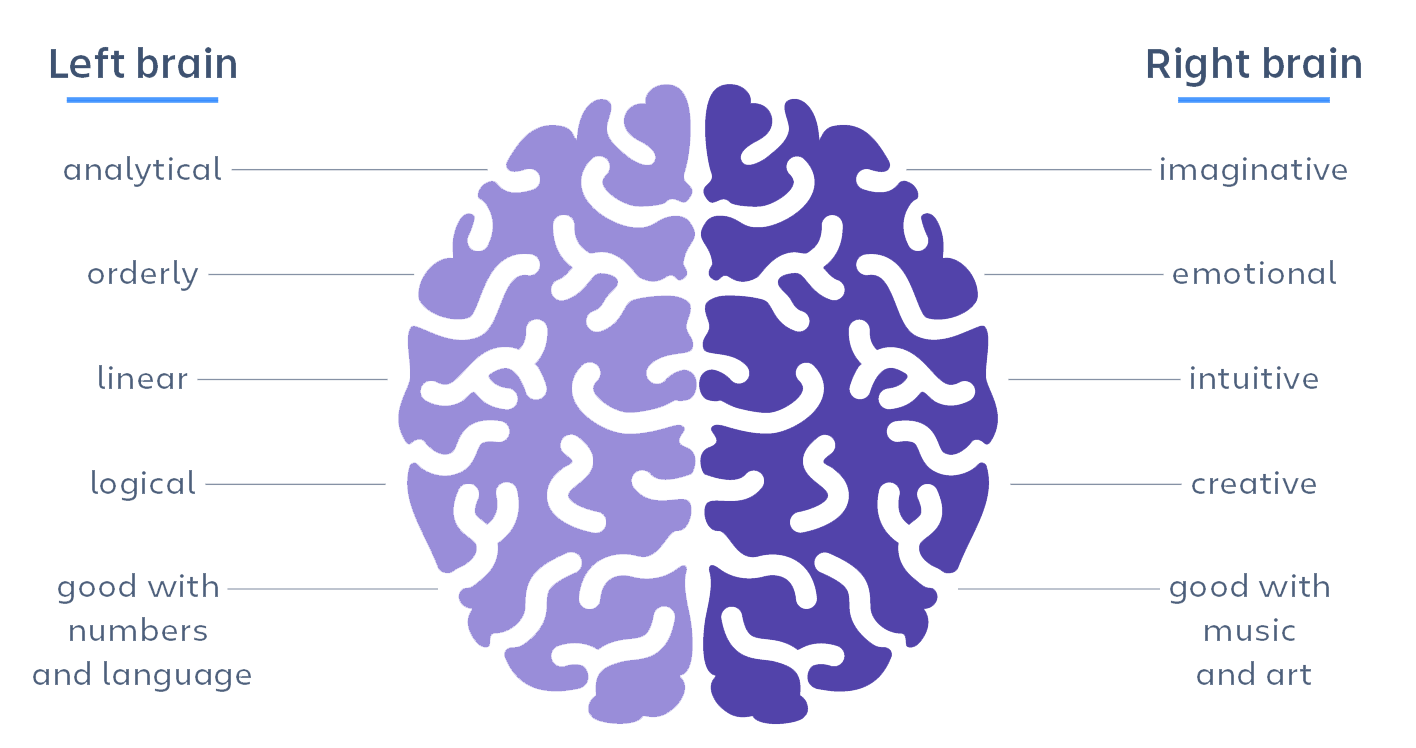
Scalp EEG activity shows oscillations at a variety of frequencies. This rhythmic activity divides into frequency bands, and the most commonly known bands are delta, theta, alpha, beta, and gamma. EEG frequency bands have been noted to have particular biological significance and are associated with different brain functioning states. There are still uncertainties about exactly where various frequencies are generated. However, on the contrary, there is substantial knowledge about the activated areas within the brain that generate specific spectral activity along the scalp. LORETA analysis of particular frequency bands can determine which brain regions are activated during different states or mental tasks, helping determine if the brain operates in an optimal way.
LORETA voxels are located in fixed positions within the brain's grey matter. It is always important to able to analyze the activation on single voxels and entire regions associated with specific brain functionalities, and Brodmann areas. Broadman areas are regions of the cerebral cortex that were defined at the beginning of the 20th century based on their cell organization. They were proven directly related to specific brain activities such as audition, vision, and motor functionalities.

LORETA is now a well-extended EEG analysis technique used worldwide. Its versatility, and the fact that the number of EEG channels and channel location is not fixed, make it possible to use this technique with almost every EEG sensor and experimental set-up. Furthermore, the possibility of studying both simultaneously as the voltage measured at the scalp surface and the 3D distribution of the generating electric neuronal activity.

Quantitative LORETA (qLORETA) processes the patient's digital 3D LORETA brain activity and statistically analyzed and compared to normative database reference values in order to provide insight into differential diagnoses and effects of treatment. The processed qLORETA is commonly converted into 3d brain maps of brain functioning called "Brain Source Analysis". The qLORETA information derived can be interpreted and used by physicians as a clinical tool to deep and more accurate evaluate brain activity and function. Our normative database includes more than 40,000 healthy subjects and large patient groups with ADHD, TBI, PTSD, Alzheimer's disease, and Depression.

Behavior Metrics


A natural process of aging includes the decline in neuro-physical and cognitive abilities. Behavior performance can be measured as it relates to the daily stressors that everyone faces, including neuro-physical, emotional, and mental challenges. The observable changes can include changes in reaction time, errors in commission (how often you make mistakes), and omission errors (how often you miss information).

These performance measures can provide an accurate snapshot and an objective assessment of a patient's ability to effectively perform general or routine daily tasks and indicate the declining level.

Frontal Asymmetry


Over the last decades, frequency-based analyses of EEG data have become much more sophisticated. One of the more advanced frequency-based metrics is frontal asymmetry or frontal lateralization.
This index of engagement and motivation typically uses beta (12 - 25 Hz) or gamma (> 25 Hz) band power, particularly in electrodes over frontal cortical regions (channels F3 and F4, for example). Researchers have consistently found that higher band power in the left vs. right frontal cortex indicates positive feelings, engagement and motivation (see Davidson, 2004; Schaffer et al., 1983). In addition, recent evidence suggests that frontal lateralization can be used to test respondents' engagement when confronted with media ads, physical products, and services (Astolfi et al., 2008; Vecchiato et al., 2012; Yilmaz et al., 2014).

Additionally, large differences in Alpha power between the left-front and right-front of the brain can be associated with low moods and can be valuable diagnostic tools for depression and anxiety.

Larger left-frontal band power may also serve as an index of engagement-related emotions such as joy. In comparison, larger right-frontal band power might indicate negative emotional states (disgust, fear, or sadness, for example). For example, EEG data from respondents watching TV advertisements would like to know which ads and which scenes drive the engagement levels of a target audience and which ones should be revised before market launch. In this case, frontal asymmetry can be computed relatively quickly from the continuous EEG data. The two electrodes needed are F3 and F4. Almost all EEG headsets comprise these standard locations. If the EEG system does not have electrodes F3 and F4, use electrodes near the original F3-F4 locations.

Biomarkers to aid for earlier detection of memory loss and dementia.